Analytical dashboards tell compelling stories, bringing lost data to spreadsheets, databases and other sources – whether they’re on-site or in the cloud.
Powerful, well-designed dashboards that combine performance with ease of use allow people to ask deeper questions. They become the springboard to discover hidden information and to help make decisions based on data. Using a self-service visual analysis platform, you will empower people to create dashboards in a secure and governed environment, creating the confidence that accurate and up-to-date data is used for analysis.
How to develop efficient dashboards?
As a dashboard creator, explorer or spectator, you want the best user experience. These steps will help you facilitate a continuous flow as you create dashboards that convince, inform and engage – helping your organization move forward with data exploration to answer questions faster, to make impact discoveries or to discover potential risks.
How do dashboards work?
First, users need to know that the definition of a dashboard depends on the role it plays in an organization. Everyone uses dashboards differently. Not all dashboards have the same purpose, which is why it is important for users to understand which KPIs to follow and why. This section answers the following questions:
- What kind of business questions do dashboards answer?
- What type of data is tracked in dashboards?
- How are the dashboards interactive?
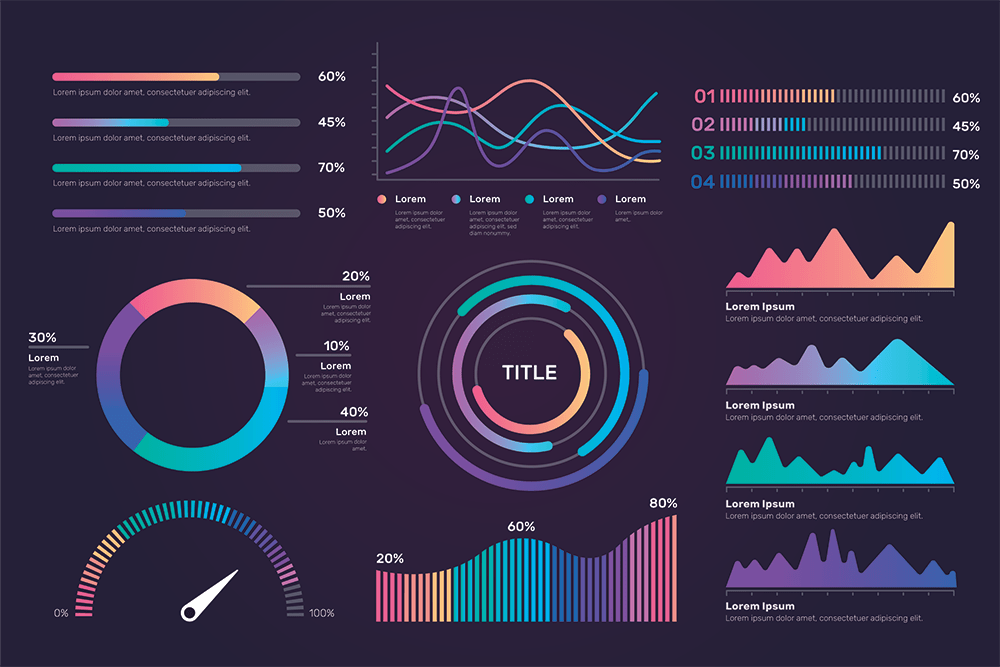
The data are viewed on a dashboard in the form of tables, line charts, charters with indicators, so that users can track the health of their business in relation to the objectives and benchmarks.
Data dashboards display the data needed to understand, monitor and improve your business through visual representations. Depending on how you decide to design your dashboard, even simple numeric data can be visually informative using intuitive symbols, such as a red triangle pointing down to indicate a drop in revenue or a green triangle pointing up. to indicate an increase in website traffic.
How does the data enter a dashboard?
Several ways. You can upload files from your old style computer, extract data from web services such as Facebook and Google Analytics, enter data from the API or as an email attachment, and access data from databases and servers. If the dashboard you are using does not have a pre-built connector for your data source, you can still connect to the dashboard. For example, you can upload CSV or Excel files.
Dashboards can visualize and bring to the surface virtually any type of information.


